By Jamie McGeever
ORLANDO, Florida (Reuters) – TRADING DAY
Making sense of the forces driving global markets
Well, that didn’t last long.
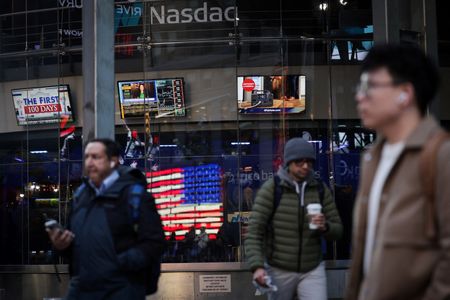
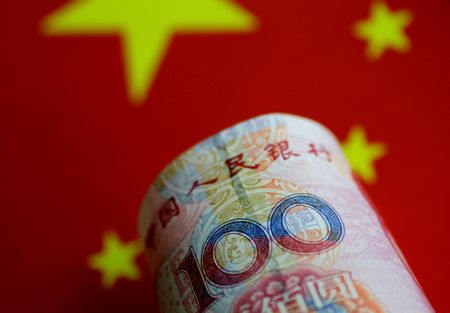
A wave of selling across global stocks on Thursday snuffed out any flickering hopes of stabilization or recovery from the previous day, as the latest salvo from U.S. President Donald Trump in the global trade war sent investors running for cover.
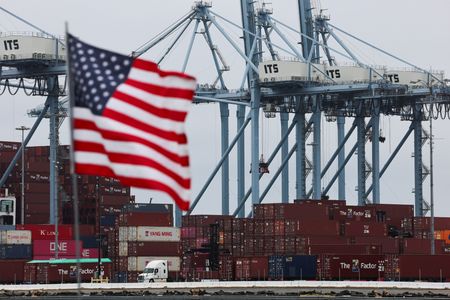
After the European Union responded to blanket U.S. tariffs on steel and aluminum by imposing a 50% tax on American whiskey exports, Trump on Thursday threatened to charge a 200% tariff on imports of European wines and spirits.
Thursday was a classic ‘risk off’ day – as they slammed stocks and riskier assets lower, investors scampered to the traditional safe-haven harbors of U.S. Treasuries, the dollar and gold, which surged to a new high just under $3,000 an ounce.
There’s a growing sense that Trump is willing to accept the economic and market damage his tariff policy is inflicting right now. Until investors can be convinced otherwise, the path of least resistance for equities and risk assets is probably to the downside, even though the selloff is getting pretty extreme.
Today’s Key Market Moves.
* The Nasdaq slumps 2% and is now down 15% from its Decemberpeak, while the S&P 500’s 1.4% fall drags it into official’correction’ territory down 10% from its peak. * Consumer cyclicals are the biggest sector decliner, down2.6%, a sign that Trump’s tariffs will hit U.S. households hard. * Intel shares are easily the best performers in the S&P500, rallying 15% as investors cheer the new incoming CEO. * The MSCI World equity index falls to a fresh six-monthlow, and is now down nearly 8% from its high. Correctionlooming. * The MSCI Asia ex-Japan index falls for a fifth straightday, its longest losing streak since November. * Gold jumps 1.7% to a new record high and is now only $15away from the $3,000 an ounce barrier.
Japanese futures are pointing to a fall of 0.7% at the open in Tokyo on Friday, and world markets can expect a rocky end to the week. Asia and Europe have performed relatively well in recent weeks, but the dam can’t hold forever.
On top of the trade chaos, investors are having to grapple with another potential worry from Washington – a partial U.S. government shutdown, which may come as soon as 12:01 a.m. local time on Saturday if lawmakers fail to agree on a stopgap funding bill.
U.S. rates traders are now fully pricing in three quarter-point rate cuts this year from the Fed, attaching a roughly 40% probability to the first of those coming in May.
Consumer price inflation on Wednesday and producer price inflation on Thursday were softer than expected, which helped fuel these increasingly dovish bets. But the deteriorating growth outlook is the main driver, and the steep losses on Wall Street will only intensify expectations that the Fed will act soon.
Would this be the ‘Fed put’? in action? Probably not, as most analysts reckon we’re still a long way from policymakers providing the sliding market a backstop. But if the snowball turns into an avalanche, you never know.
How low is the ‘Fed put’?
Every time a Wall Street selloff snowballs, fear of an avalanche revives talk of the “Fed put”. The correction underway now is no different, but the bar for the central bank to provide the market a backstop is now likely a high one.
The notion of the Fed put – the idea that the Federal Reserve will prop up falling asset prices with monetary easing or other tools – took root in the Alan Greenspan era (1987-2006) and has been embedded in investor psyche ever since.
Part of the Fed’s mandate, of course, is ensuring financial stability, so, in a sense, the Fed put has always existed and can always be used. The Global Financial Crisis of 2007-09 and the pandemic in 2020 are two examples of the Fed put in action.
As strategists at HSBC point out, the Fed put doesn’t have to be emergency rate cuts or QE. Adding a line in its policy statement that financial conditions have tightened considerably, for example, could calm the horses.
The current selloff is obviously nothing like those crises. But that hasn’t stopped speculation that further declines could soon get the Fed’s attention, with the Nasdaq now deep in correction territory – 10% or more below the previous peak – and the S&P 500 flirting with it.
There is good reason to be vigilant. The Trump administration’s chaotic trade policy agenda is generating huge uncertainty for consumers, businesses and investors, and causing recession risks to rise.
Some $5 trillion has been wiped off the value of U.S. stocks in less than a month, led by steep declines in Big Tech. The Roundhill equal-weighted ‘Magnificent Seven’ ETF is down 20% from its December peak.
Given the concentration of stock ownership in the hands of the country’s richest income decile, who now account for a record 50% of all consumer spending, weakness on Wall Street could quickly rip through the wider economy.
Policymakers will also be paying close attention to financial conditions, which are now the tightest in nearly a year, according to Goldman Sachs’ financial conditions index. This tightening is almost entirely due to the equity slump.
OUT OF THE MONEY
But the wider economic environment strongly suggests markets will have to fall much further or faster before triggering a policy response.
While volatility across equities, bonds and some key currency pairs is the highest in months and rising, it remains significantly below levels typically associated with past market crises.
The same goes for credit spreads. U.S. high-yield spreads widened beyond 300 basis points this week for the first time in six months, but that’s still miles below the spreads of 800, 900 or even 2,000 bps witnessed over the last few decades.
Liquidity also still seems, to coin a Fed term, ample. There are no gapping prices in key markets, trades can be executed smoothly, there is no sign of stress in funding markets, and the corporate bond primary market is still open for business.
What’s more, a market or economic downturn may not be as deflationary as previous slumps because any downturn now would likely be driven partly by the import tariffs President Donald Trump is threatening to impose – and tariffs risk increasing prices while hindering growth. A tumbling stock market and ‘stagflation’ would be extremely awkward for the Fed and potentially tie its hands.
Strategists at HSBC reckon the strike price of any policy put – from the Trump administration or the Fed – is probably “some ways off still”. The S&P 500’s average downturn from peaks is 14%, and even then it still usually ends the year higher with no Fed put. The market is currently 10% off its peak.
According to Treasury Secretary Scott Bessent, there is no “Trump put”, and the president himself said last week he’s “not even looking at the market.” The Trump administration appears willing to let asset prices fall and growth slow as part of the “detox period” or “transition” towards a more private sector-based economy.
Strategists at Morgan Stanley argue there’s a “much greater likelihood of a Fed Put than a Trump Put,” contrasting Trump and Bessent’s statements with Chair Jerome Powell’s recent remarks that the Fed has tools to deploy in case of extreme economic stress.
That is probably true. But the strike price might be lower than many investors would like.
What could move markets tomorrow?
* Germany wholesale inflation (February) * Germany CPI inflation (February, final) * UK indstrial production (January) * UK GDP (January) * University of Michigan U.S. consumer sentiment, inflationexpectations survey (March)
If you have more time to read today, here are a few articles I recommend to help you make sense of what happened in markets today.
1. Whether US is heading for recession or just ‘detox,’downturns are costly 2. Trump threatens tariffs on European wine and spirits inescalating trade war 3. US swaption investors pay steep price for hard-landingbets 4. Exorbitant disruption risks undermining US ‘privilege’ 5. Europe’s top money managers start to bring defencestocks in from the cold 6. The big Trump-driven market slumps, bumps and jumps incharts
I’d love to hear from you, so please reach out to me with comments at . You can also follow me at [@ReutersJamie and @reutersjamie.bsky.social.]
Opinions expressed are those of the author. They do not reflect the views of Reuters News, which, under the Trust Principles, is committed to integrity, independence, and freedom from bias.
Trading Day is also sent by email every weekday morning. Think your friend or colleague should know about us? Forward this newsletter to them. They can also sign up here.
(By Jamie McGeever; editing by Diane Craft)